Reports by day, week, month and year
Audience-to-view rate at each display
Compare screens and marketing touchpoints
API integration
Audience demographics and attention
Engagement at each marketing surface
Marketing performance
Placement performance
Reports by day, week, month and year
Control promotional content remotely
Target different groups with special content
Attract attention of shoppers
Analyze content efficiency
Relocate budgets on best-performing activities
Set content cycles and timelines
Compare screens and marketing touchpoints
Compare screens, displays and promotional stands
Find the placements that earn attention
Compare creative performance at each touchpoint
Compare campaigns across your display network
See when your target audience engages with displays
Schedule content around audience engagement
Measure attention to promotional messages
Compare audience profiles across touchpoints
Show relevant offers at the point of interest
Remote device management
Hardware map
Network monitoring
Logs of all actions
Quickly manage multiple devices with groups

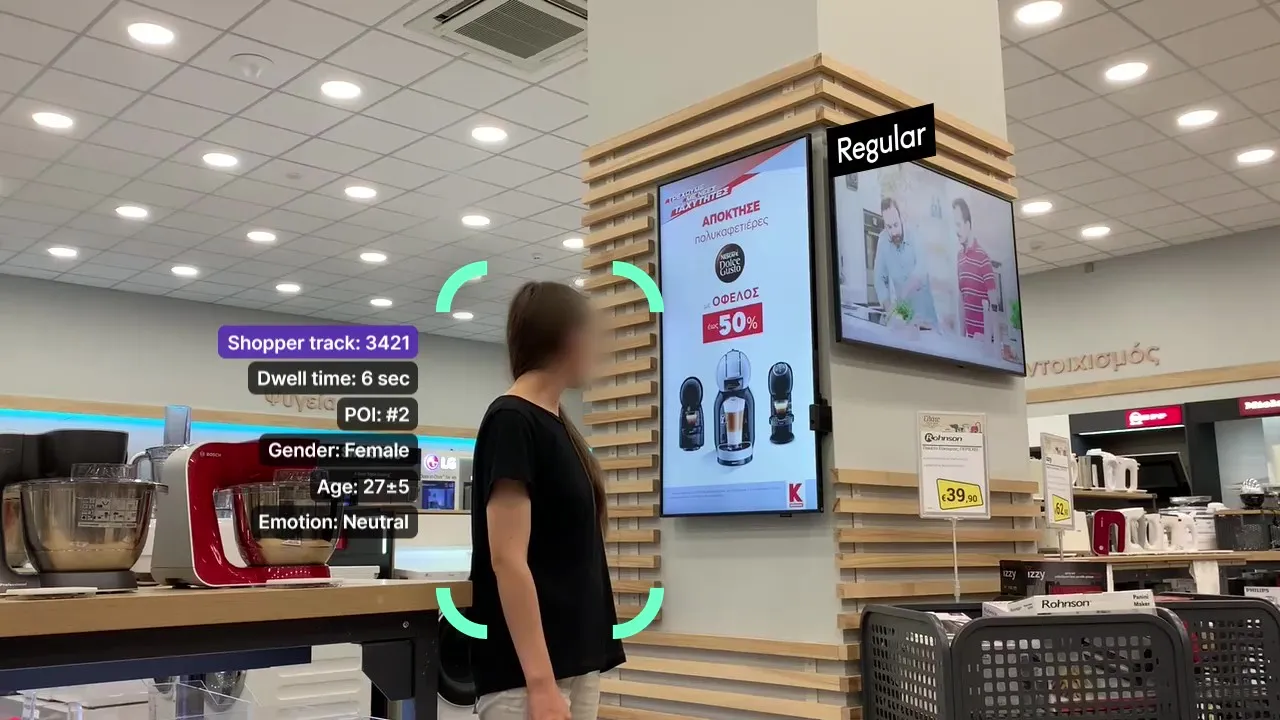
DISPL measures audience contacts, attention and aggregated demographics in the configured viewing area of your marketing surface.
With a POS or BI integration, compare aggregated engagement and sales by location, time period and product. Video analytics alone does not identify individual purchases.
Number of contacts, engagement time and other metrics will tell you how effective your content is.
Measure contacts and engagement at the display, compare placements or periods, and add aggregated sales data when an integration is available.
Compare audience contacts, estimated views and viewing time using the same measurement criteria for each campaign.
Yes, the data will show you which brand zones perform better so you can adjust your offline strategy.
Compare attention and engagement for each creative. Campaign-level reporting requires matching audience measurements with playback logs.

Age and gender data helps you get a realistic portrait of your audience and adjust your campaign message accordingly.

Use supported audience segments and engagement signals to adapt content at the display. Available attributes depend on your configured setup.
Use comparable attention and engagement metrics to decide which content and placements deserve more of your marketing budget.
Yes. Use the API to connect aggregated audience metrics with your POS or BI data by location and time period; integration scope is agreed for your project.
Yes, you can provide brands with access to actionable reports.
Place the camera on or next to the screen, checkout display or promotional stand, facing its audience. We validate angle, distance and lighting for that touchpoint. Ceiling-mounted whole-store traffic analysis is outside this offering.


DISPL Audience Analytics measures audience contacts, estimated demographics and engagement at digital screens, checkout displays and promotional stands. Position the camera on or beside the marketing surface, facing its audience. Compare attention, viewing time, content and placements. Add playback or aggregated sales data through the relevant integrations to inform marketing decisions.