We’ve just rolled out a new Visitor Insights dashboard that brings your staff activity and customer traffic into one unified view: introducing the staff presence dashboard. This powerful new tool helps you identify when and where staff are truly present, compare it to visitor dwell time, and optimize your in-store strategy.
Previous process
Our AI algorithm already collected data about the number of visitors and assigned a staff tag to ones that were noticed in front of sensors several times during the detection threshold (2 hours by default). This data was accessible via raw data export or Visitor Insights API. But we didn’t have a dedicated dashboard to work with the data without additional tools.
What’s new
New Staff presence dashboard under Insights & data:
- Automatic detection of staff presence based on repeated sensor interactions
- Adjustable detection threshold (default is 2 hours) for identifying likely team members
- Device-level filtering for analyzing specific store zones or brand areas
Breakdown of:
- Staff presence frequency
- Total visitors
- Leads (visitors spending more than 15 seconds in front of a sensor)
- Bounced leads (less than 6 seconds)
Why it matters
Retailers and brand representatives often face uncertainty about how effectively their staff is deployed, especially when dealing with shared or rotating teams across stores. The staff presence dashboard allows you to:
- Confirm if staff are present when visitor engagement is high
- Detect under- or overstaffed hours based on real traffic data
- Improve scheduling decisions using concrete, location-specific data
- Ensure high-traffic hours are supported by on-site personnel
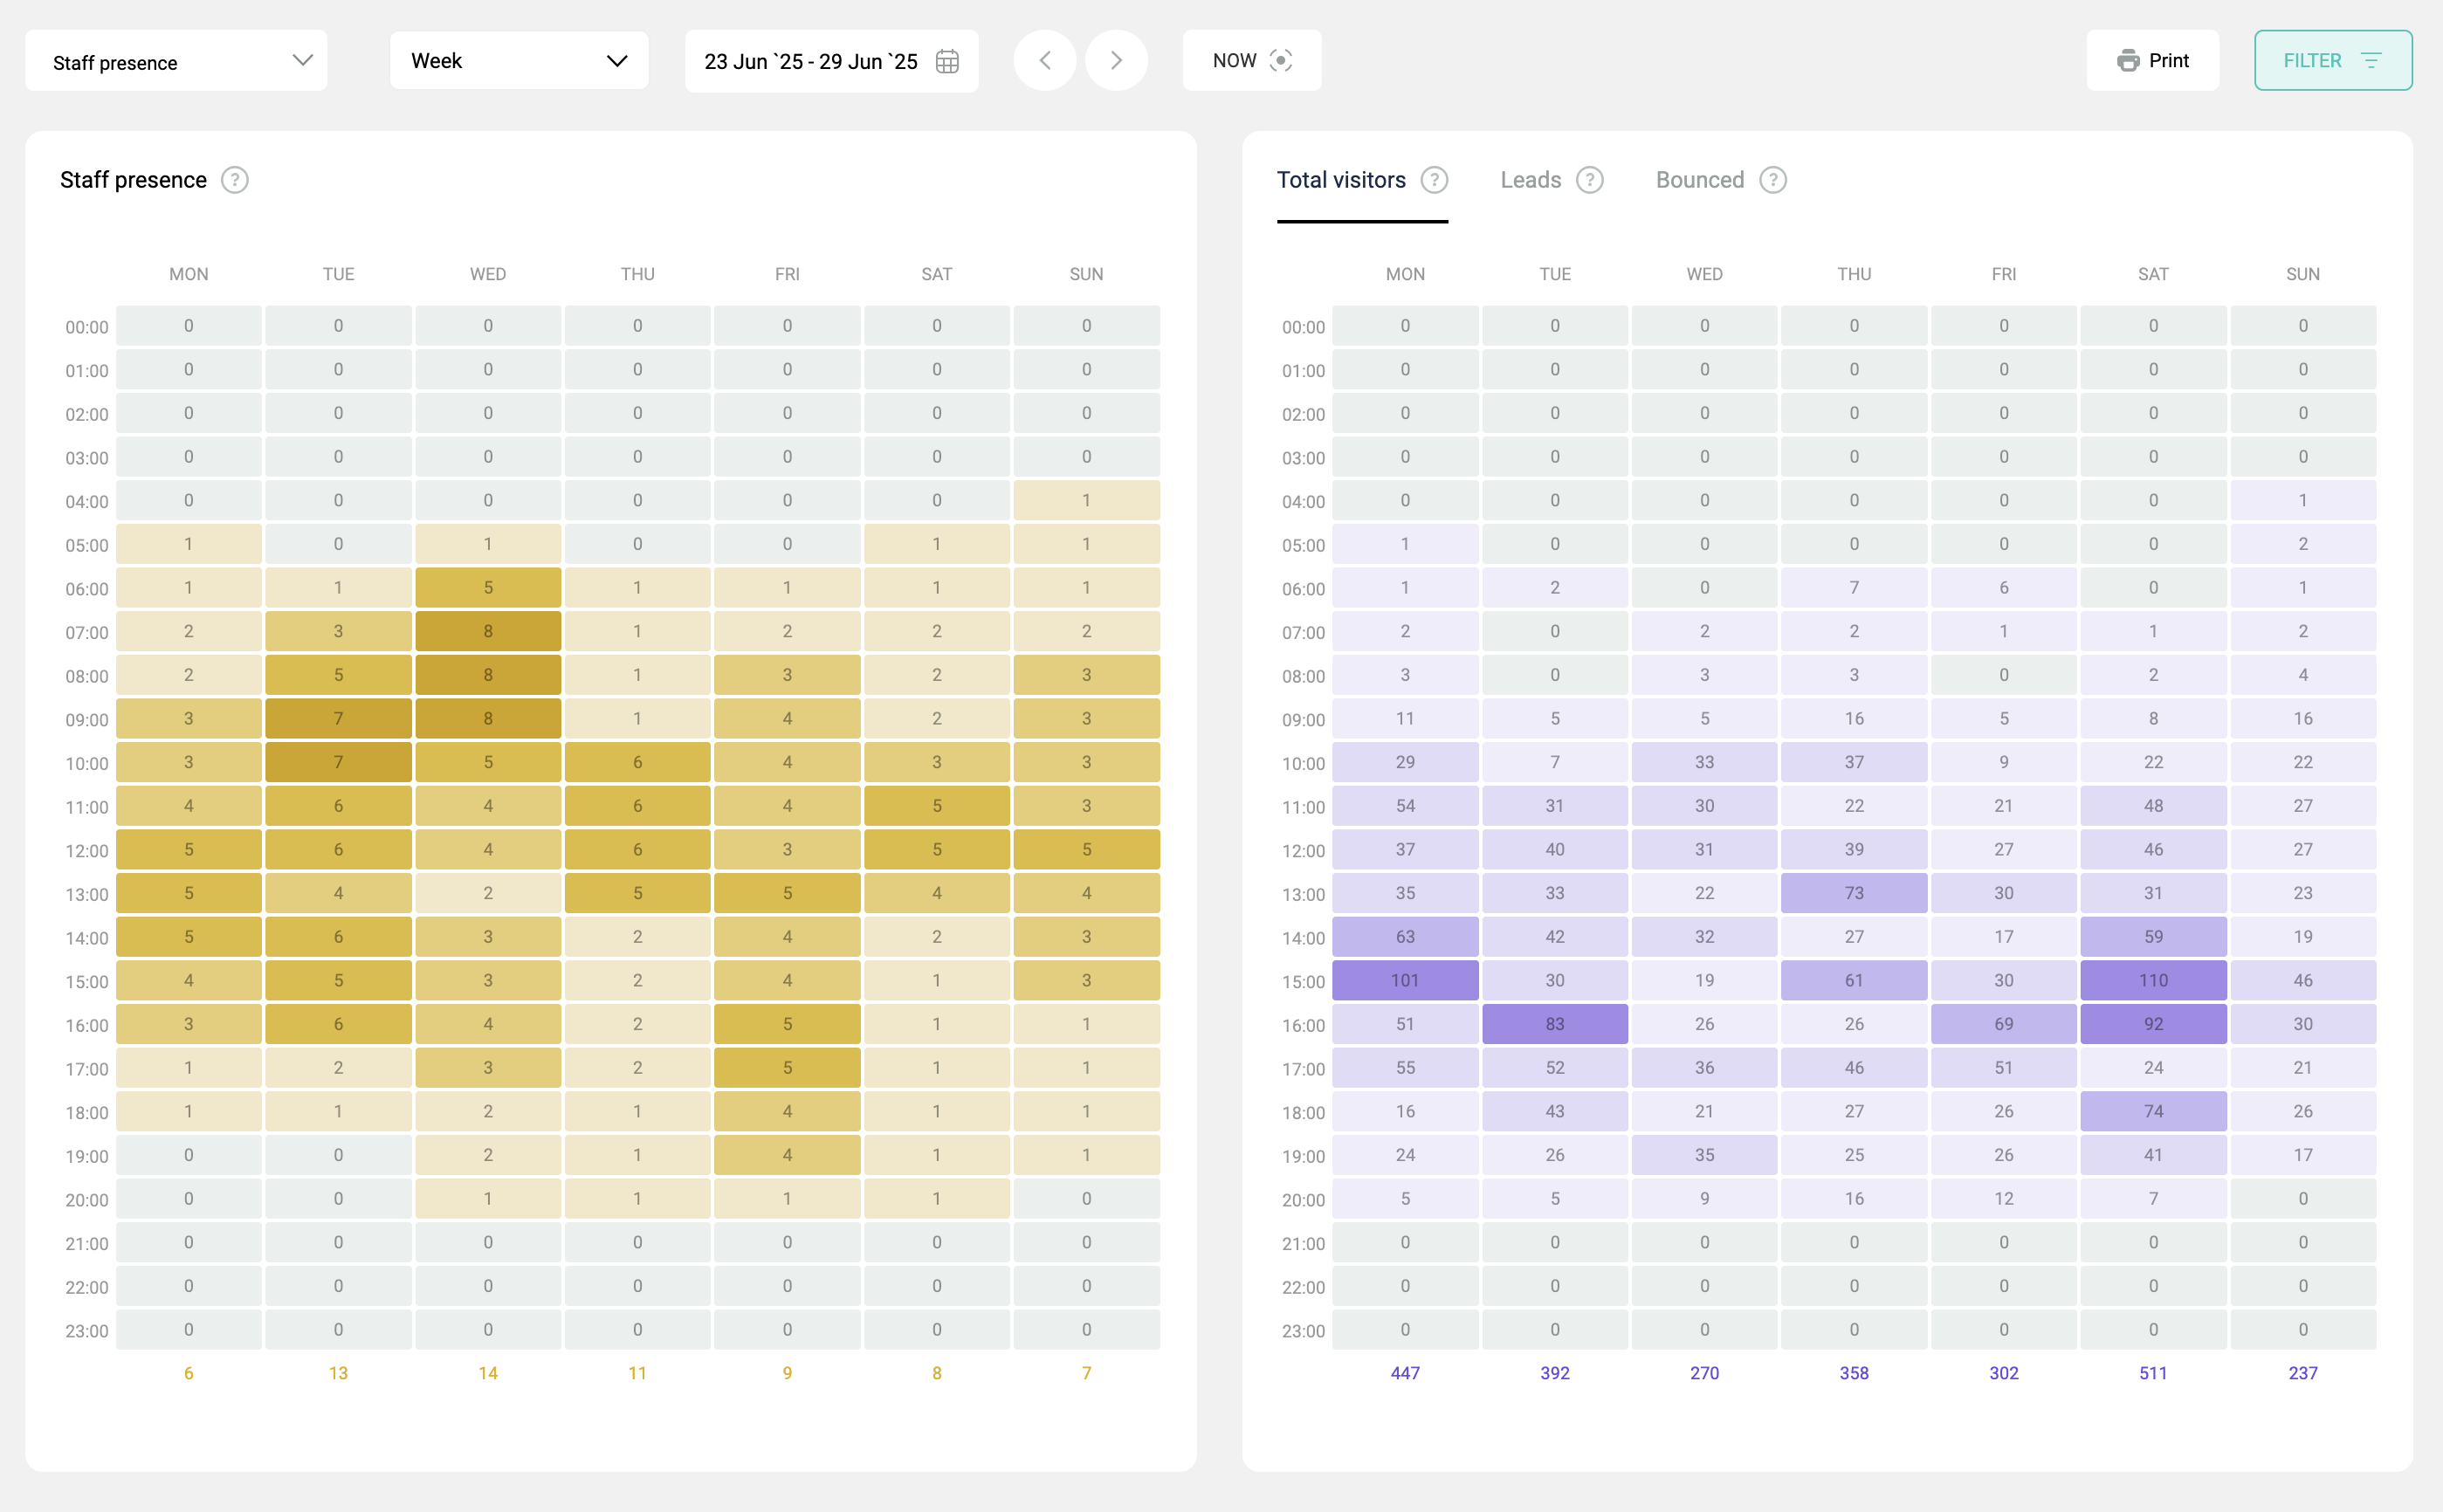
Real example: optimizing brand zones
In one recent deployment, a consumer electronics brand analyzed their promoter activity across stores. They discovered that on Saturday evenings, when customer activity was high, staff presence was low—indicating a missed sales opportunity. And on the opposite side, on Sunday, staff were present but visitor traffic was minimal. These insights helped the brand rebalance their staffing across days and locations.
Quarter analysis
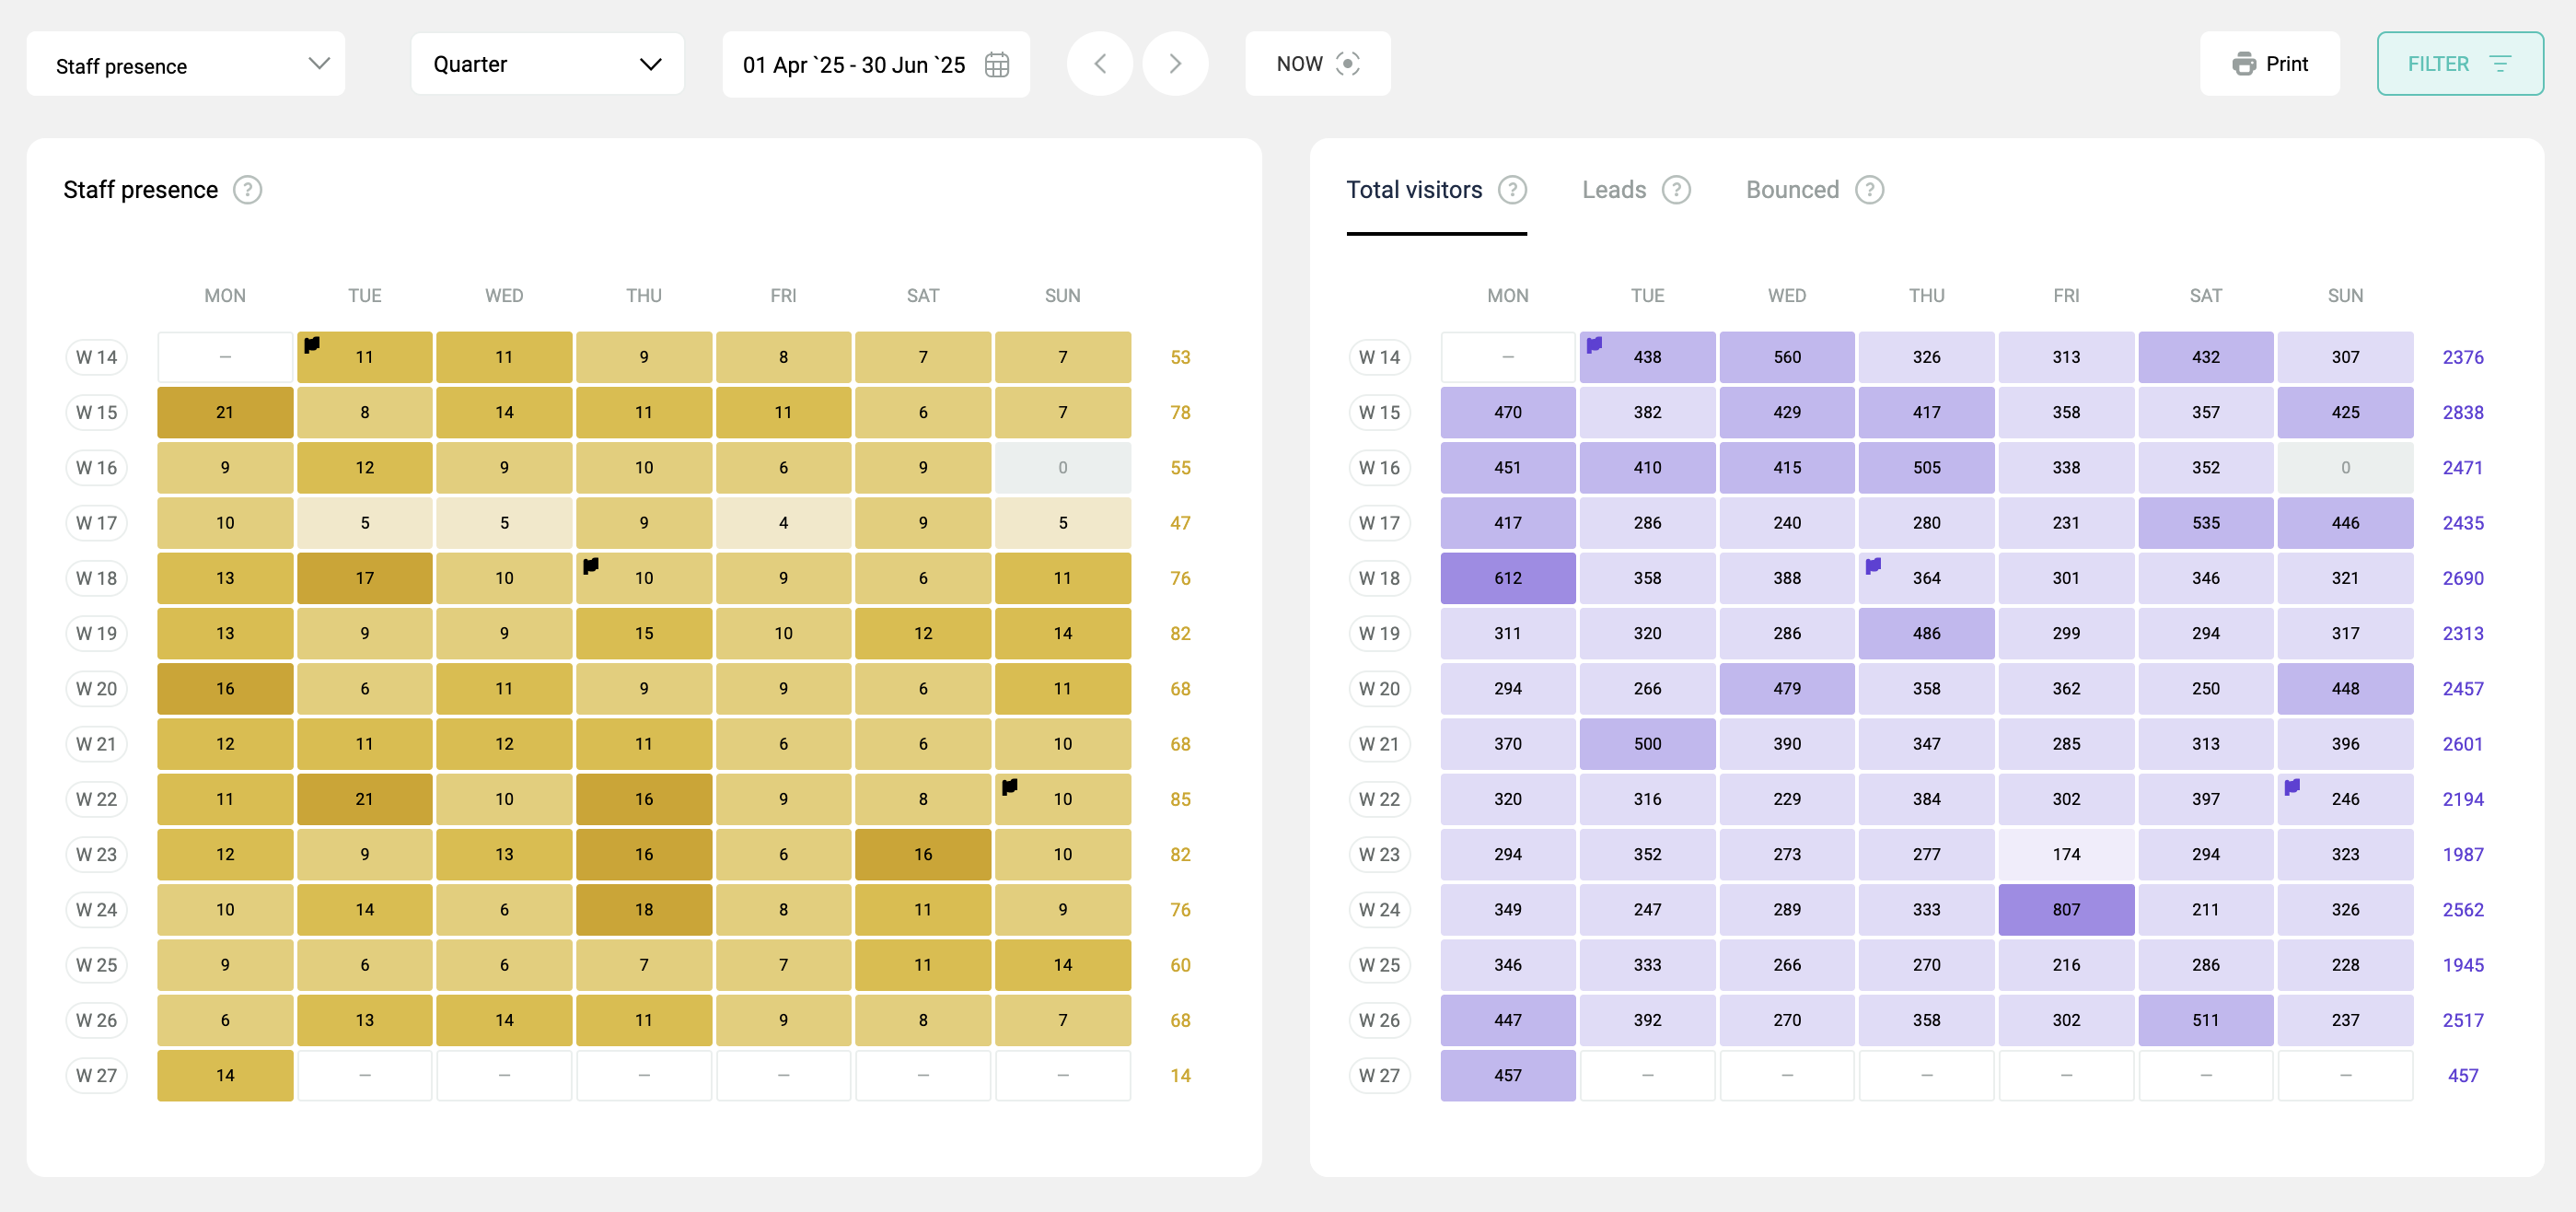
For even greater detail, the dashboard includes quarter breakdowns, showing how many times staff and traffic were present throughout each day during the three-months period. This large scale view is ideal for refining shift schedules or planning promotional campaigns.
Explore now: Go to Insights & data → Staff presence and start optimizing your staff performance and customer experience.

